Trusted, Top-Rated Realtors in Hayward, CA
Looking for a Realtor in Hayward? You're in the right spot — check out our directory of local agents who actually know the area and can help you find your next place (or sell your current one) without the headache.
Map of Businesses in Hayward
All Listings in Hayward
8 businesses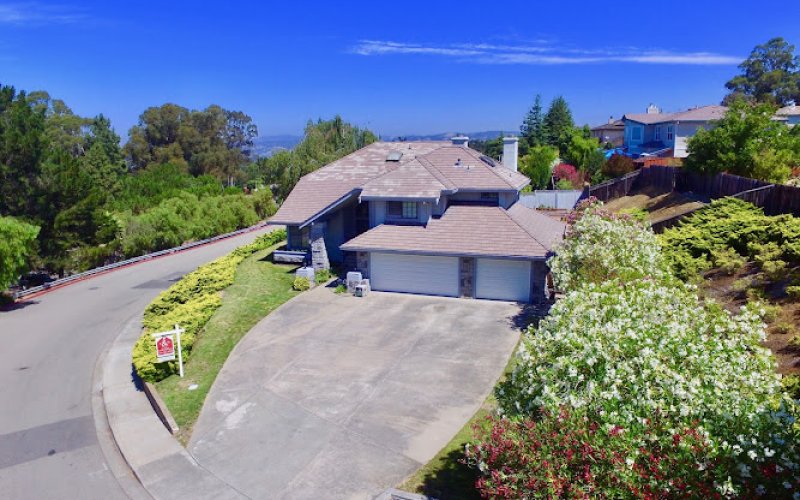
Anthony Renowitzky
Real estate agency
Cristina Bales, REALTOR | Fohl Realty & Investments
Real estate agency
Jaime Gonzalez - Envision Real Estate & Loans Inc
Real estate agent
Shadi Alkhudari Real Estate Group
Real estate agent
Cal Agents Real Estate - Hayward
Property management company
Garin Real Estate
Real estate agency
Fohl Realty & Investments
Real estate agency
Harvest Real Estate Group Inc
Real estate agencyAbout Realtors in Hayward
Hayward's median home price hit $780,000 in early 2025—down from the $900K+ peak of 2022, but still up a stubborn 31% from pre-pandemic 2019. That gap tells you everything about why navigating this market without a local agent is genuinely risky. The correction happened fast, and which streets bounced back versus which ones are still soft? That's not something Zillow tells you.
There are roughly 400+ licensed real estate agents operating in Hayward at any given time, but the ones who actually close deals here—meaning consistent, year-round production—number closer to 80–100. The market processes somewhere between 1,800 and 2,200 residential transactions annually in the 94541/94542/94544 zip codes combined, per local MLS data. Buyers break into two main camps: East Bay tech workers priced out of Fremont and San Jose, and first-generation homebuyers—often from Hayward's sizable Filipino, Mexican-American, and South Asian communities—finally cracking into ownership after years of renting.
What makes Hayward different? It's a genuine crossroads market. You've got BART access pulling buyers who need the commute, Cal State East Bay driving rental demand near the hills, and industrial employment along the Nimitz keeping working-class buyer profiles active. No single demographic owns the demand here—which means a good local realtor has to actually know all of it.
📍 South Hayward / Jackson Triangle
- Area Profile: Working-class and immigrant families, median household incomes around $72,000–$85,000. Dense, diverse, unpretentious. BART's South Hayward station sits right here.
- Realtors Activity: First-time buyer activity is heavy. Small SFRs and older condos move fast when priced right—sometimes 7–10 days to offer.
- Price Range: $550,000–$720,000 for most SFRs. Condos still findable sub-$500K.
- Local Note: Agents who don't know the flood zone pockets near Dixon Street have burned buyers before. Ask specifically.
📍 Fairview / Upper B Street Corridor
- Area Profile: Hillside neighborhood with older ranch homes, higher owner-occupancy rates, quieter streets. Median incomes push $110,000+.
- Realtors Activity: Move-up buyers. Families upgrading from flat Hayward. Less turnover than flatlands, so when something lists, competition spikes.
- Price Range: $820,000–$1.1M depending on lot size and view.
- Local Note: Fire risk zone designations here matter—insurance costs jumped 40%+ for some properties in 2023–2024. Your realtor should be raising this without you asking.
📍 Downtown Hayward / Mission Boulevard
- Area Profile: Mixed-use, younger renters transitioning to buyers, some CSUEB adjacency. Ongoing city revitalization has been "ongoing" for about 15 years now, but there's genuine new multifamily inventory finally coming online.
- Realtors Activity: Condos and townhomes dominate. Investor purchases remain active.
- Price Range: $450,000–$680,000 for attached units.
- Local Note: HOA fees vary wildly in this corridor—some buildings run $600+/month. Agents here need to break down true cost of ownership, not just list price.
📊 Current Price Points:
- Entry-level: $480,000–$620,000 — older condos, Cherryland SFRs needing work
- Mid-range: $680,000–$850,000 — the most active segment, flatland SFRs with 3BR+
- Premium: $900,000–$1.2M+ — Fairview hills, updated homes, larger lots
📈 Market Trends right now:
- Active inventory up approximately 18% year-over-year as of early 2025—buyers have more options than 2022, full stop
- Average days on market: 22–28 days for correctly priced homes (vs. 9 days at peak)
- Price reductions happening on roughly 31% of listings per MLS data
- Interest rate sensitivity is extreme here—each half-point move visibly shifts offer volumes within weeks
- Seasonal peak: March through June drives roughly 40% of annual transaction volume
💰 What people are actually spending on agent services:
- Standard seller-side commission: 2.5–3% (though post-NAR settlement structures are shifting this)
- Buyer agent compensation: increasingly negotiated case-by-case, often 2–2.5%
- Full-service listing packages (photos, staging consultation, MLS): typically bundled into commission
- Flat-fee or discount broker options exist locally—but transaction support quality varies significantly
Hayward's population sits around 162,000—relatively flat over the past five years (sub-1% annual growth), but the household formation pressure is real. Rental vacancy rates hover around 4.2%, which keeps pushing renters toward buying even when prices feel painful.
Major employers include Kaiser Permanente (one of the largest single employers in the city), the Hayward Unified School District, and a dense cluster of biotech and life sciences firms along the I-880 industrial corridor—think companies operating near Depot Road and Whipple. These jobs produce stable $90,000–$140,000 household incomes that feed directly into the $700K–$900K purchase range.
- Hayward median household income: ~$92,000 vs. California statewide ~$91,000 (basically a wash)
- New BART-adjacent development projects near South Hayward station adding future inventory pressure
- 580/880 interchange access keeps Hayward competitive vs. Fremont and Union City for commuters
Look, the real driver here is displacement pressure from San Jose and Fremont. When Fremont's median clears $1.1M, Hayward at $780K starts looking rational to the same buyer profile. Agents who understand that comparison dynamic close more deals.
- ☀️ Spring (March–May): Peak inventory AND peak competition. You'll see more choices but also more multiple-offer situations. Sellers have the leverage.
- ☀️ Summer (June–August): Inventory starts tapering but families motivated by school year timing are still active. Market stays warm.
- 🍂 Fall (September–November): Underrated window. Motivated sellers who didn't close in spring often make price concessions. Less competition from buyers.
- ❄️ Winter (December–February): Slowest period by volume—but the buyers still active are serious. Negotiating power shifts noticeably toward buyers.
- 📅 Peak negotiating months: November through January. Properties sitting 45+ days tend to get real with pricing.
Smart Timing Tips:
- ✓ Get pre-approved in January to be ready when spring inventory hits—don't wait until you find a house
- ✓ Watch for price drops on properties listed in April that are still active in July—those sellers are ready to deal
- ✓ Avoid closing in December if possible—title companies and city permit offices run skeleton crews
- ✓ Tax return season (February–April) spikes first-time buyer activity in South Hayward specifically—move before that wave hits
California requires all real estate agents to hold a license through the California Department of Real Estate (CalDRE). You can verify any agent's license status, including disciplinary history, at the CalDRE public license lookup at dre.ca.gov. Takes 90 seconds. Do it.
- Look for NAR membership (grants access to MLS) and ideally a local affiliate with the Bay East Association of Realtors—the regional body covering Hayward
- Designations like CRS (Certified Residential Specialist) or ABR (Accredited Buyer's Representative) signal ongoing education, not just a pulse
- Check Google and Yelp reviews—but read the 3-star reviews, not just the 5s. That's where the real texture lives.
⚠️ Red Flags Specific to Hayward Realtors:
- Agent quotes a listing price suspiciously high to win your listing, then pushes for price reductions two weeks in—classic overpricing-to-impress move, common here
- No local sales history in Hayward zip codes specifically—agents parachuting from Pleasanton or Fremont don't know the micro-market quirks
- Pressure to use their preferred lender, inspector, or title company without disclosing any referral relationship (legally must be disclosed in CA)
- Vague answers about post-NAR settlement buyer agreement terms—any agent not clearly explaining the new buyer representation agreement structure is behind
Where to verify: CalDRE license lookup, BBB (bbb.org), and the Bay East Association of Realtors. For review patterns, look for agents with 20+ reviews spanning multiple years—not a burst of 5-stars from 2023 and nothing since.
✓ Verifiable closed sales in Hayward—ask for their production report, not just testimonials
✓ Clear, written buyer or listing agreement explaining every fee before you sign anything
✓ Response time under 4 hours during active search—this market still moves fast on well-priced homes
✓ References from clients who were in your same situation (first-time buyer, investor, estate sale, etc.)
✓ Honest conversation about what you can realistically get for your budget—not just what you want to hear
No verifiable local sales history in Hayward in the past 18 months
Refuses to provide a written fee agreement before starting work
Pushes you to waive inspection contingencies without fully explaining the risk—I've seen this hurt buyers badly in Hayward's older housing stock
Can't name a single neighborhood-specific factor that affects pricing in your target area. That's not a realtor. That's a license holder.
Cost Calculator
Check Reviews & Ratings
We recommend verifying businesses through trusted review platforms before making a decision.
Frequently Asked Questions
Popular Categories in Hayward
Explore Other Cities
🏡 Realtors near Hayward
Professional Categories in Hayward, CA
Related Services from Similar Professionals